Market Cycles
The charts will be updated by
every Saturday. When no change to text, [NC] will be used.
[NC] The stock market moves in various cycles. They are
described in Wikipedia. For
this website, there are two that will be used to try and understand
(predict) the market movement. There is an annual
cycle where the market tends to move up from late October
to June (the Power Zone), and there is the four-year Presidential Cycle. Money
on Wall Street also moves back and forth from the stock market to the
bond market depending on the greed and fear in the market place. This
will be tracked below.
Stock & Bond Cycles
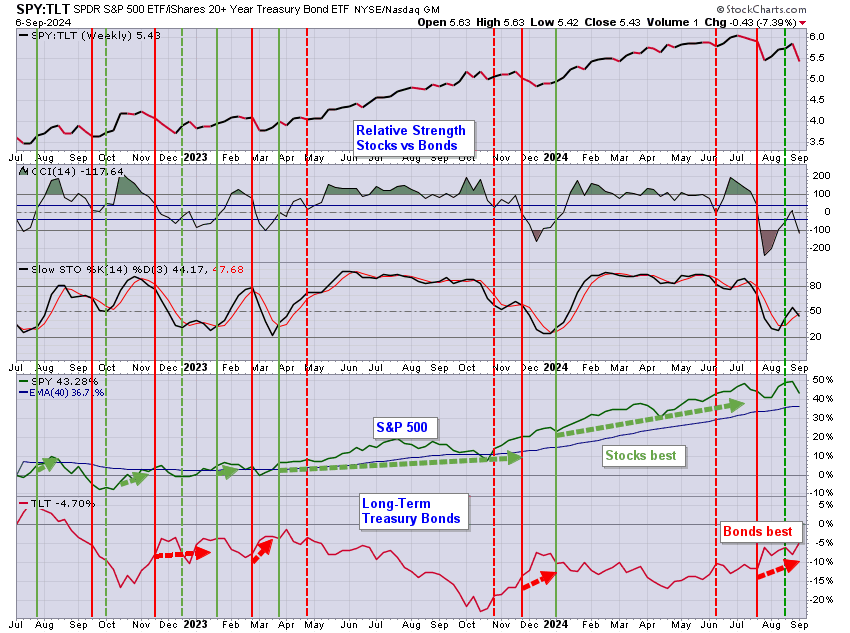
[NC] The markets move on the perception by the traders as to the safety of positions in the stock market. The dropping interest rates cause the bonds to rise in price (as discussed on the Income page). The weekly chart below shows this movement between markets using the relative strength of the S&P 500 ETF (SPY) to the 20+ Year Treasury Bond fund from iShares (TLT).[NC] This relative strength (SPY:TLT) is shown in the top pane. The second pane has two indicators, and the upper one determines the switch points indicated by the vertical poles. This indicator is the 14-day CCI and the signals are based on a cross below the 40 level for a switch to bonds, and a cross above the -40 level to switch to stocks. Charts of the SPY and TLT are shown in the lowest pane with arrows to show the favored investment. These two charts are shown on a percentage scale to show how much faster stocks move than bonds. Bonds do provide a capital gain as well as monthly interest. These charts show the total return.
[NC] Bonds are favored. The signal went to stocks on 9/20/2024, now it's bonds favored as of 2/8/2025.
The 1st Year of the Presidential Cycle
[NC] The average
first year of the presidential
cycle (PY1) is shown in the charts
below, contrasted with all years. PY1 is, on average, good in
January, and then good again from early April to early August.
Averaged over all years,
the market does well until early September. Then from the end of
October to the end of the year is a nice rally.
[NC] From 1928 to 2016, over all years, the S&P 500 (SPX) has an
average annual gain of 7.9%. In the 1st year of the
Presidential Cycle the SPX has an average gain of 9.4%.

[NC] From 1963 to 2016, over all years, the Nasdaq (OTC) has an average annual gain of 11.3%. In the 1st year of the Presidential Cycle the OTC has an average annual gain of 10.5%. It struggles in February and March, and then moves up.

[NC] From 1979 to 2016, over all years, the Russell 2000 (R2K)
has
had an average annual gain of 10.9%. In the 1st year of the
Presidential Cycle the R2K has an
average gain of 17.5%. It does not do well in late February or August and September.
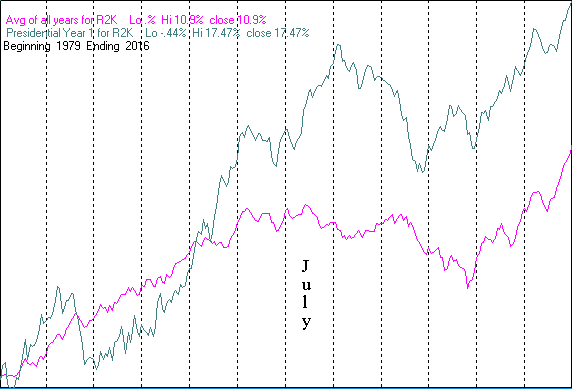
Thanks to Mike
Burk for the charts.
[NC] In 2011, the third year of the presidential cycle produced the following gains and losses. These were disappointing for any year!
- Dow Jones Industrials (DJIA) +5.5%
- S&P 500 (SPX) 0.0%
- Nasdaq (OTC) -1.8%
- Russell 2000 (R2K) -5.5%
[NC] In 2012, the fourth year of
the presidential cycle produced the following gains. These are much
better than the averages shown in the table.
- Dow Jones Industrials (DJIA) +7.3%
- S&P 500 (SPX) +13.4%
- Nasdaq (OTC) +15.9%
- Russell 2000 (R2K) +14.6%
[NC] In 2013, the first year of the presidential cycle produced the following gains. Spectacular!
- Dow Jones Industrials (DJIA) +26.5% [Total return of 29.6%]
- S&P 500 (SPX) +29.6% [Total return of 32.4%]
- Nasdaq (OTC) +38.3%
- Russell 2000 (R2K) +37.0% [Total return of 38.7%]
[NC] In 2014, the second year of the presidential cycle produced the following gains. These are better than average for the second year.
- Dow Jones Industrials (DJIA) +7.5% [Total return of DIA 9.8%]
- S&P 500 (SPX) +11.4% [Total return of SPY 13.5%]
- Nasdaq (OTC) +13.4%
- Russell 2000 (R2K) +3.5% [Total return of IWM 5.0%]
[NC] In 2015, the third year of
the presidential cycle produced the following gains. This was not a
good year. Dividends did help as shown by the total return numbers.
- Dow Jones Industrials (DJIA) -2.23% [Total return of DIA +0.11%]
- S&P 500 (SPX) -0.73% [Total return of SPY +1.25%]
- Nasdaq (OTC) +5.73%
- Russell 2000 (R2K) -5.71% [Total return of IWM -4.47%]
[NC] In 2016, the fourth year of the presidential cycle produced the following gains. This was a crazy year and the surprises are summarized in this chart. Dividends did help and management costs subtracted, as shown by the total return numbers of the ETFs.
- Dow Jones Industrials (DJIA) +13.42% [Total return of DIA +13.52%]
- S&P 500 (SPX) +9.54% [Total return of SPY +9.64%]
- Nasdaq (OTC) +7.50%
- Russell 2000 (R2K)
+19.48% [Total
return of IWM +19.64%]0
Circuit Breaker Avoids Big Stock Market Drops
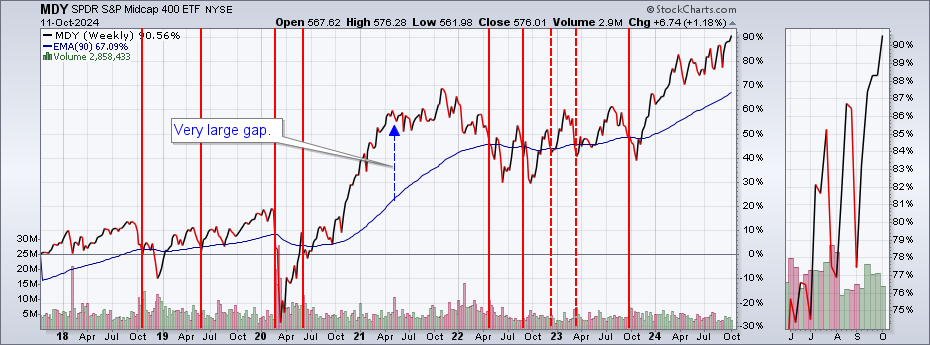
[NC] The Circuit-Breaker Sell Alert indicated a SELL signal on 9/22/2023, which was confirmed on 9/29.
[NC] The 7-year chart shows a weekly plot of the S&P 400 MidCap MDY
with a 90-week EMA, which works well with this ETF. It is a
Circuit-Breaker Sell and not a buy indicator. It avoided the
small drops of the 2003 to 2007 bull run and the 2010 drop. The
cross-over in 2011 occurred in August so Power Zone investors would be
out of the market anyway. One would delay market entry at the start of
the Power Zone until the price of MDY rises above the EMA.
Annual Seasonal Cycle & the Power Zone
[NC] Late October to May is the strongest time of the
year for the stock market -- the Power
Zone. Since 1950, the average daily return of the Dow
Industrials has been 27 times greater from October to May than the
average daily returns for the other five months (appreciation
only). Rebalancing a portfolio at the start and end of the Power
Zone makes sense.
For an analysis of the best time of year for certain types of stocks, check out this article.
[NC] April 11, 2024: The Power Zone ended after the VIX sell alert and a down market was declared.
[NC] November 3, 2023: The Power Zone began with the VIX buy alert.
[NC] August 2, 2023: The power zone continued much longer than usual, but ended with a VIX sell alert.
[NC] October 26, 2022: The Power Zone began with the VIX buy alert.
[NC] October 15, 2021: The Health and VIX alerts both are BUY indicating the start of the Power Zone.
[NC] May 10, 2021: The Health Sell Alert
signaled the end of the Power Zone on May 10. The VIX Sell Alert
followed on May 11.
[NC] October 9, 2020:
The Power Zone started when the VIX Buy Alert went to a buy.
[NC] March 6, 2020: The
Circuit Breaker sell signal terminated the Power Zone.
[NC] October 26, 2019:
The Power Zone began with a Health Buy Alert on Wednesday 10/23.
[NC] May 18,
2019: A Health Sell
Alert occurred on Monday 5/13, which signals the end of the Power
Zone. During the typical third year of the presidential cycle,
the markets are good until mid-July. This year's price action is your
guide.
[NC] May 4,
2019: Should we go away in
May? Certainly not while the Health Buy Alert is in force.
This third year of the presidential cycle is normally powerful even
outside the power zone. According the the charts above, mid-July
might be the best time to "go away."
[NC] January 12, 2019: A
Health Buy Alert occurred on 1/10/2019, so the Power Zone is in effect.
The market is still in a bear trend, so caution is necessary.
[NC] October 27, 2018:
The Power Zone will begin when there is a Health Buy Alert.
[NC] June 30, 2018: The Power Zone is over as the
there will likely be a Health Sell Alert on Monday, 7/1. The
unfavorable time of the year is upon us. Note: There was no sell
alert 7/1, but the unfavorable time still stands.
[NC] September
30, 2017: The market has been moving up dramatically with all
indexes making new all-time highs on Friday 9/29. On 9/27, a
dramatic 2.0% move in the Russell 2000 small-cap index defined the
start of the Power Zone. As shown in the bar chart below, October is
usually a very good month.
[NC] May
20, 2017: The Power Zone is over due to the -1.8% drop on
Wednesday 5/17. Political uncertainty and
the least good four months of the year are upon us. Note
the May 6 comments and chart below.
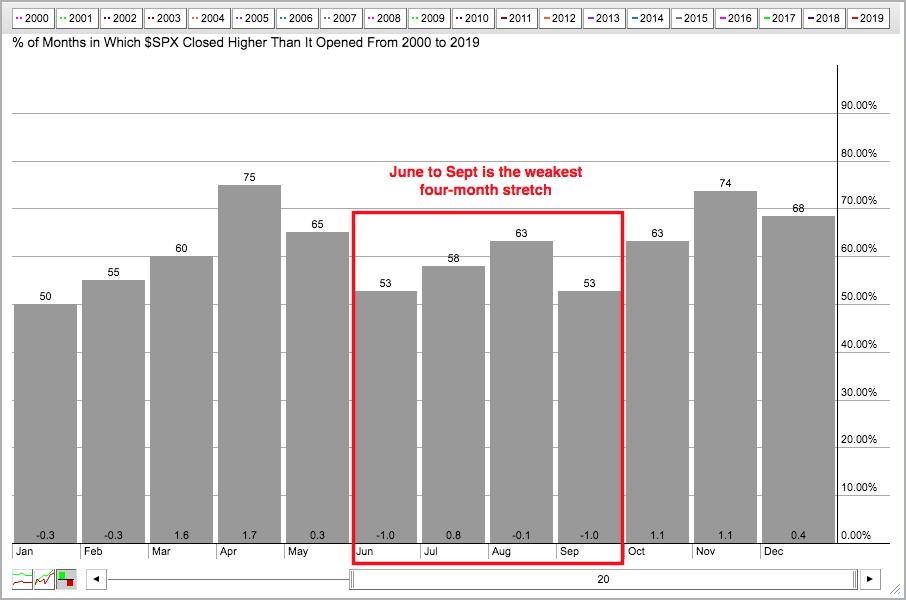
[NC] May 6, 2017: The Power Zone referred
to in the analysis was based on market action using a
six-month Power Zone from November 1 through April 30. The chart
below shows the percentage of months over the last 20 years that were
positive; and that the market generally is not as good
only in the summer months of June, July, August and
September. Arthur Hill of StockCharts.com, who provided this chart,
stated that on average, SPY closed higher just 52.7% of the time during
these four months. Moreover, the ETF averaged a 1.1% loss over this
stretch. Therefore, definition of the Power Zone will
generally be eight months long and start on October 1, if the market is
going up at that time. Mid-October has seen the bottom of
many major downswings.
[NC] On
11/5/16: "The Power Zone is likely to have started as the market, as
of November 4, 2016, is very oversold. The uncertainty
of the election has delayed its start." On 11/12: November 4 was
the bottom of the election fear drop. The Trump rally then began the
Power Zone.
[NC] The
Power Zone referred to in green below ended on April 28,
2016. This was dramatic on the Nasdaq exchange with a -1.8% drop
in two days. The recent high on the Nasdaq was on April 18,
and the S&P 500 peaked two days later.
[NC] The
last Power Zone started on Thursday October 22, 2015 when the
S&P 500 had a large move on higher than normal volume. This was
confirmed by the Nasdaq which gapped up on Friday and closed
+2.3%. There was a Health Buy Alert on Monday 10/12.
-
- - - - - - - - -
- - - - - - - - -
- - - - - - - - -
- - - - - - -
[NC] Should you sell in May? Here is a bar chart of the S&P over five years. Move the slider to get earlier years back to 1990. To see a percentage chart over the five years, click the chart symbol icon in the lower left of the chart. Other symbols (sector ETFs) can be observed also by entering them at the top.
[NC] The total return of the S&P 400 Mid-Cap
MDY (red) is shown on a 10-year log chart below. NOTE this chart
ends 6/24/2016 when the data became too expensive. The
Power Zone System (red & green curve) shows the
MDY fund (red) when invested from November 1 through
April 30 of each year, and in a money-market fund (green)
during the unfavorable time of the year.
[NC] There were parts of three years when you should have been
out during the favorable time -- the 2007-2009 bear
market. Therefore, a Circuit-Breaker Sell Rule is needed for
this and any other longer-term strategy. One might consider a 90-week
EMA of the MDY (see second chart below). Most of the
time the transition to the (green) money-market was at a higher price
than the year before. The annualized returns for several funds
from 4/28/2006 to 12/31/2013 are given below. The advantage gap
between the two returns narrowed significantly in 2013.
| Fund | Symbol | Buy&Hold | PwrZoneSys |
| S&P 400 Mid-Cap | MDY |
8.19% |
12.54% |
| S&P 500 Large-Cap | SPY |
6.75% |
8.49% |
| Consumer Discretionary | XLY |
10.82% |
13.17% |
| Homebuilders S&P |
XHB |
-1.90% |
17.65% |

Chart and data by FastTrack.net.
[NC] Jerry Minton has a slightly different favorable period, which he calls the Power Zone. He says that "The principal cause of this skewing effect is the behavior of investors in response to the overly optimistic forecasts (for the next calendar year) of the army of highly paid, respected, and confident "experts" pronouncing on everything from company earnings to the stock market, GDP, interest rates, the price of oil, etc. Most of the time these experts get it wrong and begin to revise their earlier estimates downward during the following summer, thus producing the May to November Dead Zone."