Investing for Income
The charts will be updated by
every Saturday. When no change to text, [NC] will be used.
Interest Rates
Interest rate futures indicate what the Fed might do with the rate in the future as given by the CME Group’s FedWatch Tool.
Fed officials completed the tapering off their
bond
buying program in March 2022. Then they started rate cutting to prosper the economy. Now that trend is on pause.
[NC] The corona virus impact on the economy caused a recession. The
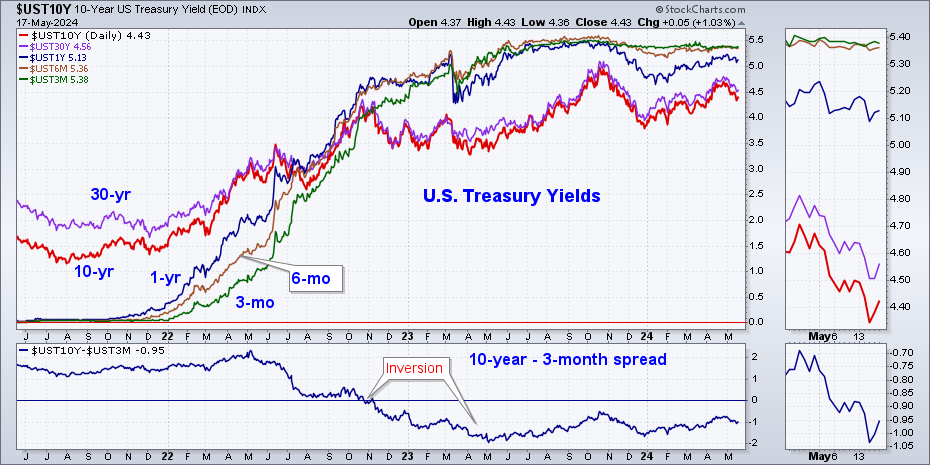
10-year to 3-month Treasury yield inversion is the most reliable signal
of future recession, according to researchers at the San Francisco Fed, and it worked again in 2020.
Inversions of that spread have preceded each of the past seven
recessions, including the 2007-2009 contraction, according to the
Cleveland Fed. They say it’s offered only two false positives — an
inversion in late 1966 and a “very flat” curve in late 1998.
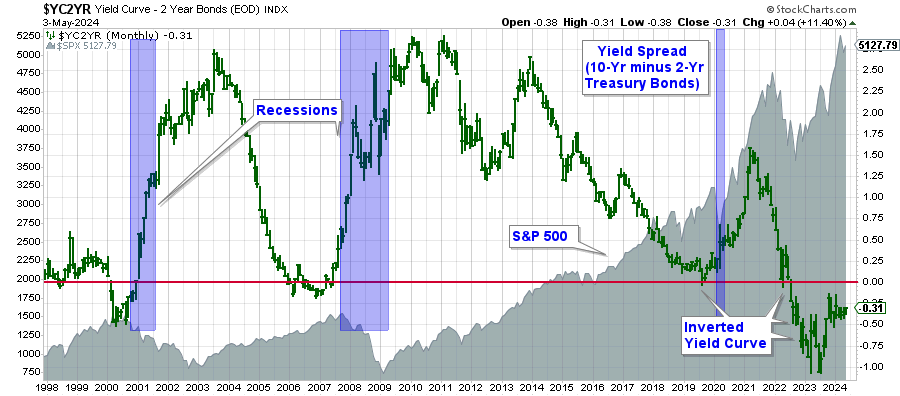
[NC] The 10-year minus 2-year yield spread is shown below since 1998, where a negative spread indicates an inverted yield curve. A flattening yield curve is often a warning of a slowing economy and a potential stock market peak. An inverted yield curve generally forecasts a future recession. It has preceded all of the past seven recessions since 1970, typically by four or five quarters. This yield curve inverted in the first week of April 2022 and again in the weeks ending July 15 and 22, and NOW. Notice that the past recessions have occured after the inversion ended by quite a few months. On 9/6/2024 it went above the zero line.
[NC] Yields and history of global government bonds can be seen by clicking here.
Income Portfolio
Allocations for a portfolio can be divided into bonds (or other income funds), dividend-paying stocks and cash. Cash can be kept in a brokerage money market fund. The Fidelity FDRXX fund yields 4.04%. The Schwab SWVXX fund yields 4.19%. A bank CD or an interest paying savings account is another approach and selections can be found here. The purchasing power of cash will deteriorate due to inflation.
Short-term bond funds and bank-loan funds would be other lower-risk considerations, but they do fluctuate with the on-going rate changes. Ultra-safe 6-month Treasury bills are yielding around 4.25% and taxed only at the Federal level (see above chart). The amount kept in these depends on your risk tolerance. Rebalancing your stock/bond portfolio to maintain your percentages can be done periodically. May and October are suggested as this would synchronize with the Power Zone.
[NC] Treasury Series I (Inflation) Bonds provide a return of 3.11% (annualized) for the first six months and must be held one year. This rate holds until the end of April 2025. The composite rate for Series I Savings Bonds is a combination of a fixed rate of 1.20%, which applies for the 30-year life of the bond, and the semiannual inflation rate. The interest is compounded every six months. If the bond is held less than five years, three months of interest is forfeited when sold.
[NC] Most equity index funds are capitalization weighted -- meaning the largest corporations get a greater percentage of the money invested in the fund. Bond index funds are different. They are structured according to the amount borrowed by the corporation. The largest borrowers get a higher percentage of the fund's invested money. The corporations' capacity to service their debt is not considered. Active bond managers aren't bound by the requirements of an index. Rob Arnott of Research Affiliates says the way to win in bond investing is to avoid defaults, which is where an active manager's judgment and credit analysis comes in. However, funds that contain a large number of bonds cushion any one bond default. In a strong economy, defaults should not be a problem and high-yield bonds should be considered.
Dividend-Paying Stock Funds
[NC] As discussed under the Observations tab, bonds do not give much income in this time of low interest rates. Investors have been supplementing their bond income with dividend-paying stocks. It was noted recently that rising interest rates puts downward pressure on high-dividend paying stocks as interest on bonds becomes more competitive for income investors. Stocks also raise the portfolio risk, but can be managed with attention and periodic rebalancing. Funds, rather than stocks, provide diversification, as a bad earnings report from a company can affect its stock price significantly.
[NC] The chart below shows the last six months. This chart shows four dividend ETFs together with a light blue investment-grade corporate bond fund (LQD) and the black S&P 500 SPDRs (SPY) for comparison. Click here for the latest or to add your ETF or stock to the chart. A similar chart for bond funds is below.

[NC] The distribution yield (as of 8/23/2024) and expense
ratio (ER) are given in the table.
-
Fidelity MSCI Utilities Index Fund - FUTY [Yields 2.84%, ER 0.08%] - Utilities go up as rates go down.
-
iShares U.S. Real Estate ETF - IYR [Yields 2.42%, ER 0.40%] - Real Estate goes up as rates go down.
-
PowerShares High Yield Dividend Achievers Portfolio - PEY [Yields 4.65%, ER 0.52%]
-
Invesco S&P 500 Low Volatility ETF - SPLV [Yields 2.19%, ER 0.25%]
-
iShares iBoxx Investment Grade Corporate Bond Fund - LQD [Yields 4.10%, ER 0.14%]
- Eldridge BBB-B CLO ETF - CLOZ [Yields 7.52%, ER 0.50%] -
CLOs and their underlying loans are floating-rate assets with low
duration risk.
- SPDR S&P 500 Fund - SPY [Yields 1.20%, ER 0.09%]
Bond Funds
[NC] Bonds provide a balance to an equity
portfolio. Individual
bonds would need to be held to maturity in a rising
interest rate environment. Long or intermediate-term bonds might
be bought as interest rates have started down, raising the bond prices.. Due
to inflation, Treasury Inflation Protection Securities (TIPS) should be
considered, although they are not doing too well recently. Click here to learn the subtitles of TIPS.
[NC] Bond fund holdings are weighted giving the highest weight to
the borrowers that have the largest debt. That would seem to encourage
companies to take on more debt, which would not be good when economic
activity starts to drop. Also consider floating-rate funds and senior
bank loan funds that are described below. These are short-term and
thus have little sensitivity to interest rate changes.
[NC] There are three types of risk in the bond
market:
Interest rate risk, bond default risk, and liquidity risk. Interest
rate risk occurs if rates rise causing the price of bonds to decline.
As interest rates fall, bond prices rise, which would result in a
capital gain that would be added to the income stream. The default
risk depends on the quality of the bond as rated: AAA down to
below junk status CCC. Liquidity risk is a measure of the
ability of the bond dealer to buy bonds or sell bonds from his
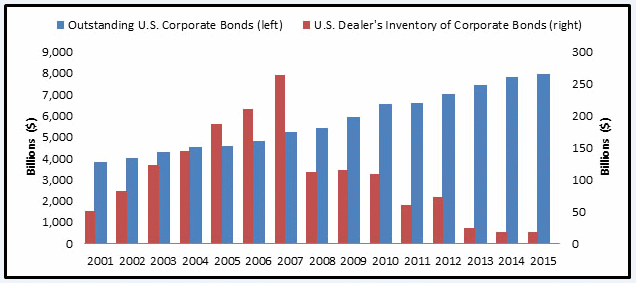
inventory to service the market. Inventories have been dropping
dramatically in the last few years, as shown below. The price of bond
ETFs sometimes lags behind or gets ahead of its NAV (net asset value),
which is based on an index. This dislocation is described in this article.
[NC] This six-month chart shows
the recent movement of
the total return (interest reinvested) of various
typical bond-type funds. Treasuries (blue and light green) have received the most money as they are
the ultimate "safe haven." See below for the
sensitivity of bonds to interest rate changes. Click here for the latest. Note measures of risk in the
table below.
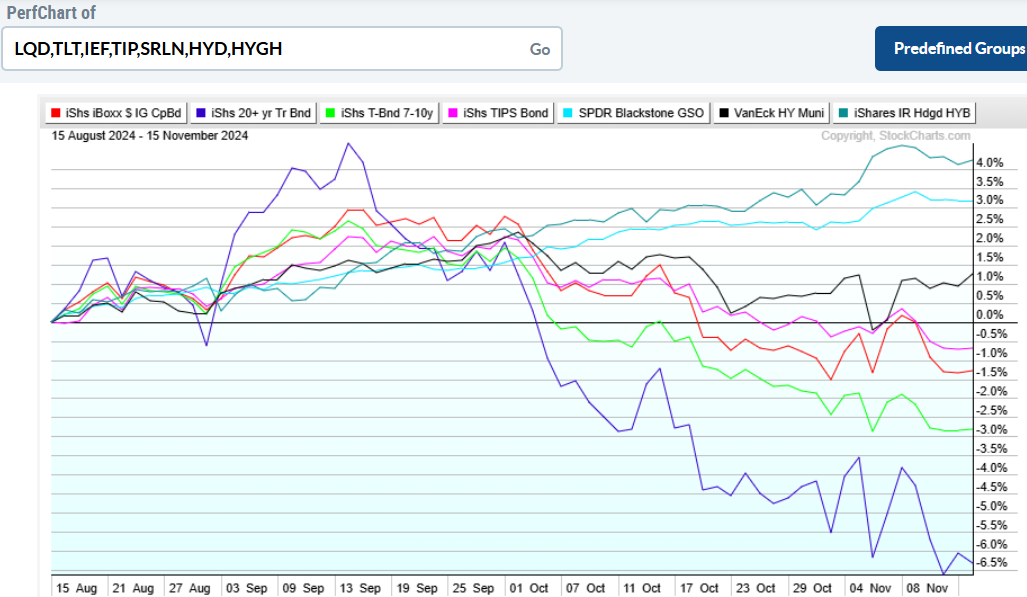
[NC] The yields to maturity and descriptions
below are as of 8/16/2024. The chart above shows the
volatility and impact of changing rates -- demonstrated by the blue 20-
year Treasury bond fund. Duration is a measure of
the sensitivity of bonds to interest rate changes. A bond with a
5-year duration will move down 5% if the market interest rate for the
bond increases 1%. Therefore, short-term bonds are safer than these shown
here.
-
iShares iBoxx Investment Grade Corporate Bond Fund - LQD [Yield 4.14% with duration of 8.44 years]
- iShares 20 Year Treasury Bonds - TLT (Yield 3.69% with duration of 16.6 years]
-
iShares 7-10 Year Treasury Bonds - IEF [Yield 3.24% with duration of 7.18 years]
-
iShares TIPS iShares ETF - TIP [Yield 3.04% with duration of 6.71 years]
-
iSharesCore Total US Bond Market - AGG [Yield 5.99% with duration of 6.31 years] not shown
- iShares National AMT-Free Muni Bond Fund - MUB [Yield 2.86%] not shown
- iShares Floating Rate Bond ETF - FLOT [Yield 5.87%] not shown
- SPDR Blackstone GSO Senior Loan ETF - SRLN [Yield 9.05%, duration not applicable]
- VanEck Vectors High Yield Municipal Index ETF - HYD [Yield 4.29%]
- iShares Interest Rate Hedged High Yield Bond ETF - HYGH [Yield 9.01%, duration zero]
- Eaton Vance Senior Floating Rate Trust (Closed-End Fund) - EFR [Yield 10.69%] not shown
[NC] The iShares Core US
Aggregate Bond ETF (AGG) with 75 billion in
assets is the fund has become the standard for measuring bond fund
returns. It's
expense ratio is only 0.04%.
[NC] Intermediate-term
US Treasury bonds are represented by the iShares 7-10
Year Treasury Bond Fund (IEF). It has a duration of
7.69 years so it is somewhat more sensitive to interest rates then AGG. Its expense ratio is 0.15%.
[NC] The US Treasury inflation-protected
securities can be held in iShares TIPS Bond ETF
(TIP). It is has an expense ratio of
0.20%. TIPS are good if inflation is rising along with
interest rates. If inflation is minimal and rates are rising,
TIPS will decline in value like regular bonds as the duration is long. The distribution is paid monthly.
[NC] Corporate
bonds have done better than Treasuries as shown in
the chart above. They will drop faster as rates rise. iShares iBoxx Investment Grade Corporate Bond
Fund (LQD) has 53 billion in assets and a 0.15%
expense ratio.
[NC] Vanguard has
a good international bond fund
(BNDX). It is currency hedged, which is important with
the US Dollar moving. It has 5,990 holdings. Details can be
found at http://etfdb.com/etf/BNDX/. The average
effective duration is 7.5 years, so this is an intermediate-term bond
fund. Yield to maturity is 0.84% and expenses are
0.08%.
[NC] Municipal bond funds offer Federal tax
free and sometimes AMT free bonds. The iShares National Muni Bond
Fund (MUB) is one of the largest with a
low 0.07% expense ratio. It holds 4,400 securities. VanEck
Vectors High Yield Municipal Index ETF (HYD) gives a higher yield
with a higher expense ratio of 0.35%. HYD targets bonds that are
rated below investment grade and thus contains issues that have a much
higher chance of default, although it holds over 1,800 securities.
[NC] PIMCO Enhanced Short-Maturity
ETF (MINT) is yielding 2.27% with 0.36% annual
expenses. It has an average duration of 0.32 years, and is
actively managed.
[NC] Senior bank loans are loans to borrowers that have below investment grade credit ratings. In the event of a default, these bank loans are repaid before other creditors. They are short-term loans and the ETF tends to increase in price when interest rates rise. SPDR Blackstone GSO Senior Loan ETF SRLN has a 0.70% expense ratio. This ETF provides actively managed exposure to noninvestment-grade, floating-rate senior secured debt of US and non-US corporations that resets in 3 months or less. Read more here.
[NC] High-yield bonds move more like stocks. The iShares iBoxx High-Yield Corporate Bond fund HYG is a 3-star fund with an expense ratio of 0.49%. It's duration is 9.4 years with 74% of holding in the U.S. There is an interest rate hedged fund HYGH, the iShares High Yield Interest Rate Hedged fund. This fund has a duration of zero with an expense ratio of 0.51%.
[NC] If interest rates go up, bond prices will go down, unless sold at or near maturity. Rates are quite low now -- and the Fed is expected to keep the (short-term) Federal Funds Rate as it has been doing. However, the long-term rates are market driven. An analysis of this chart can be found here. A chart of long-term interest rates back to when the U.S. Constitution was ratified in 1788 is provided by Barron's.
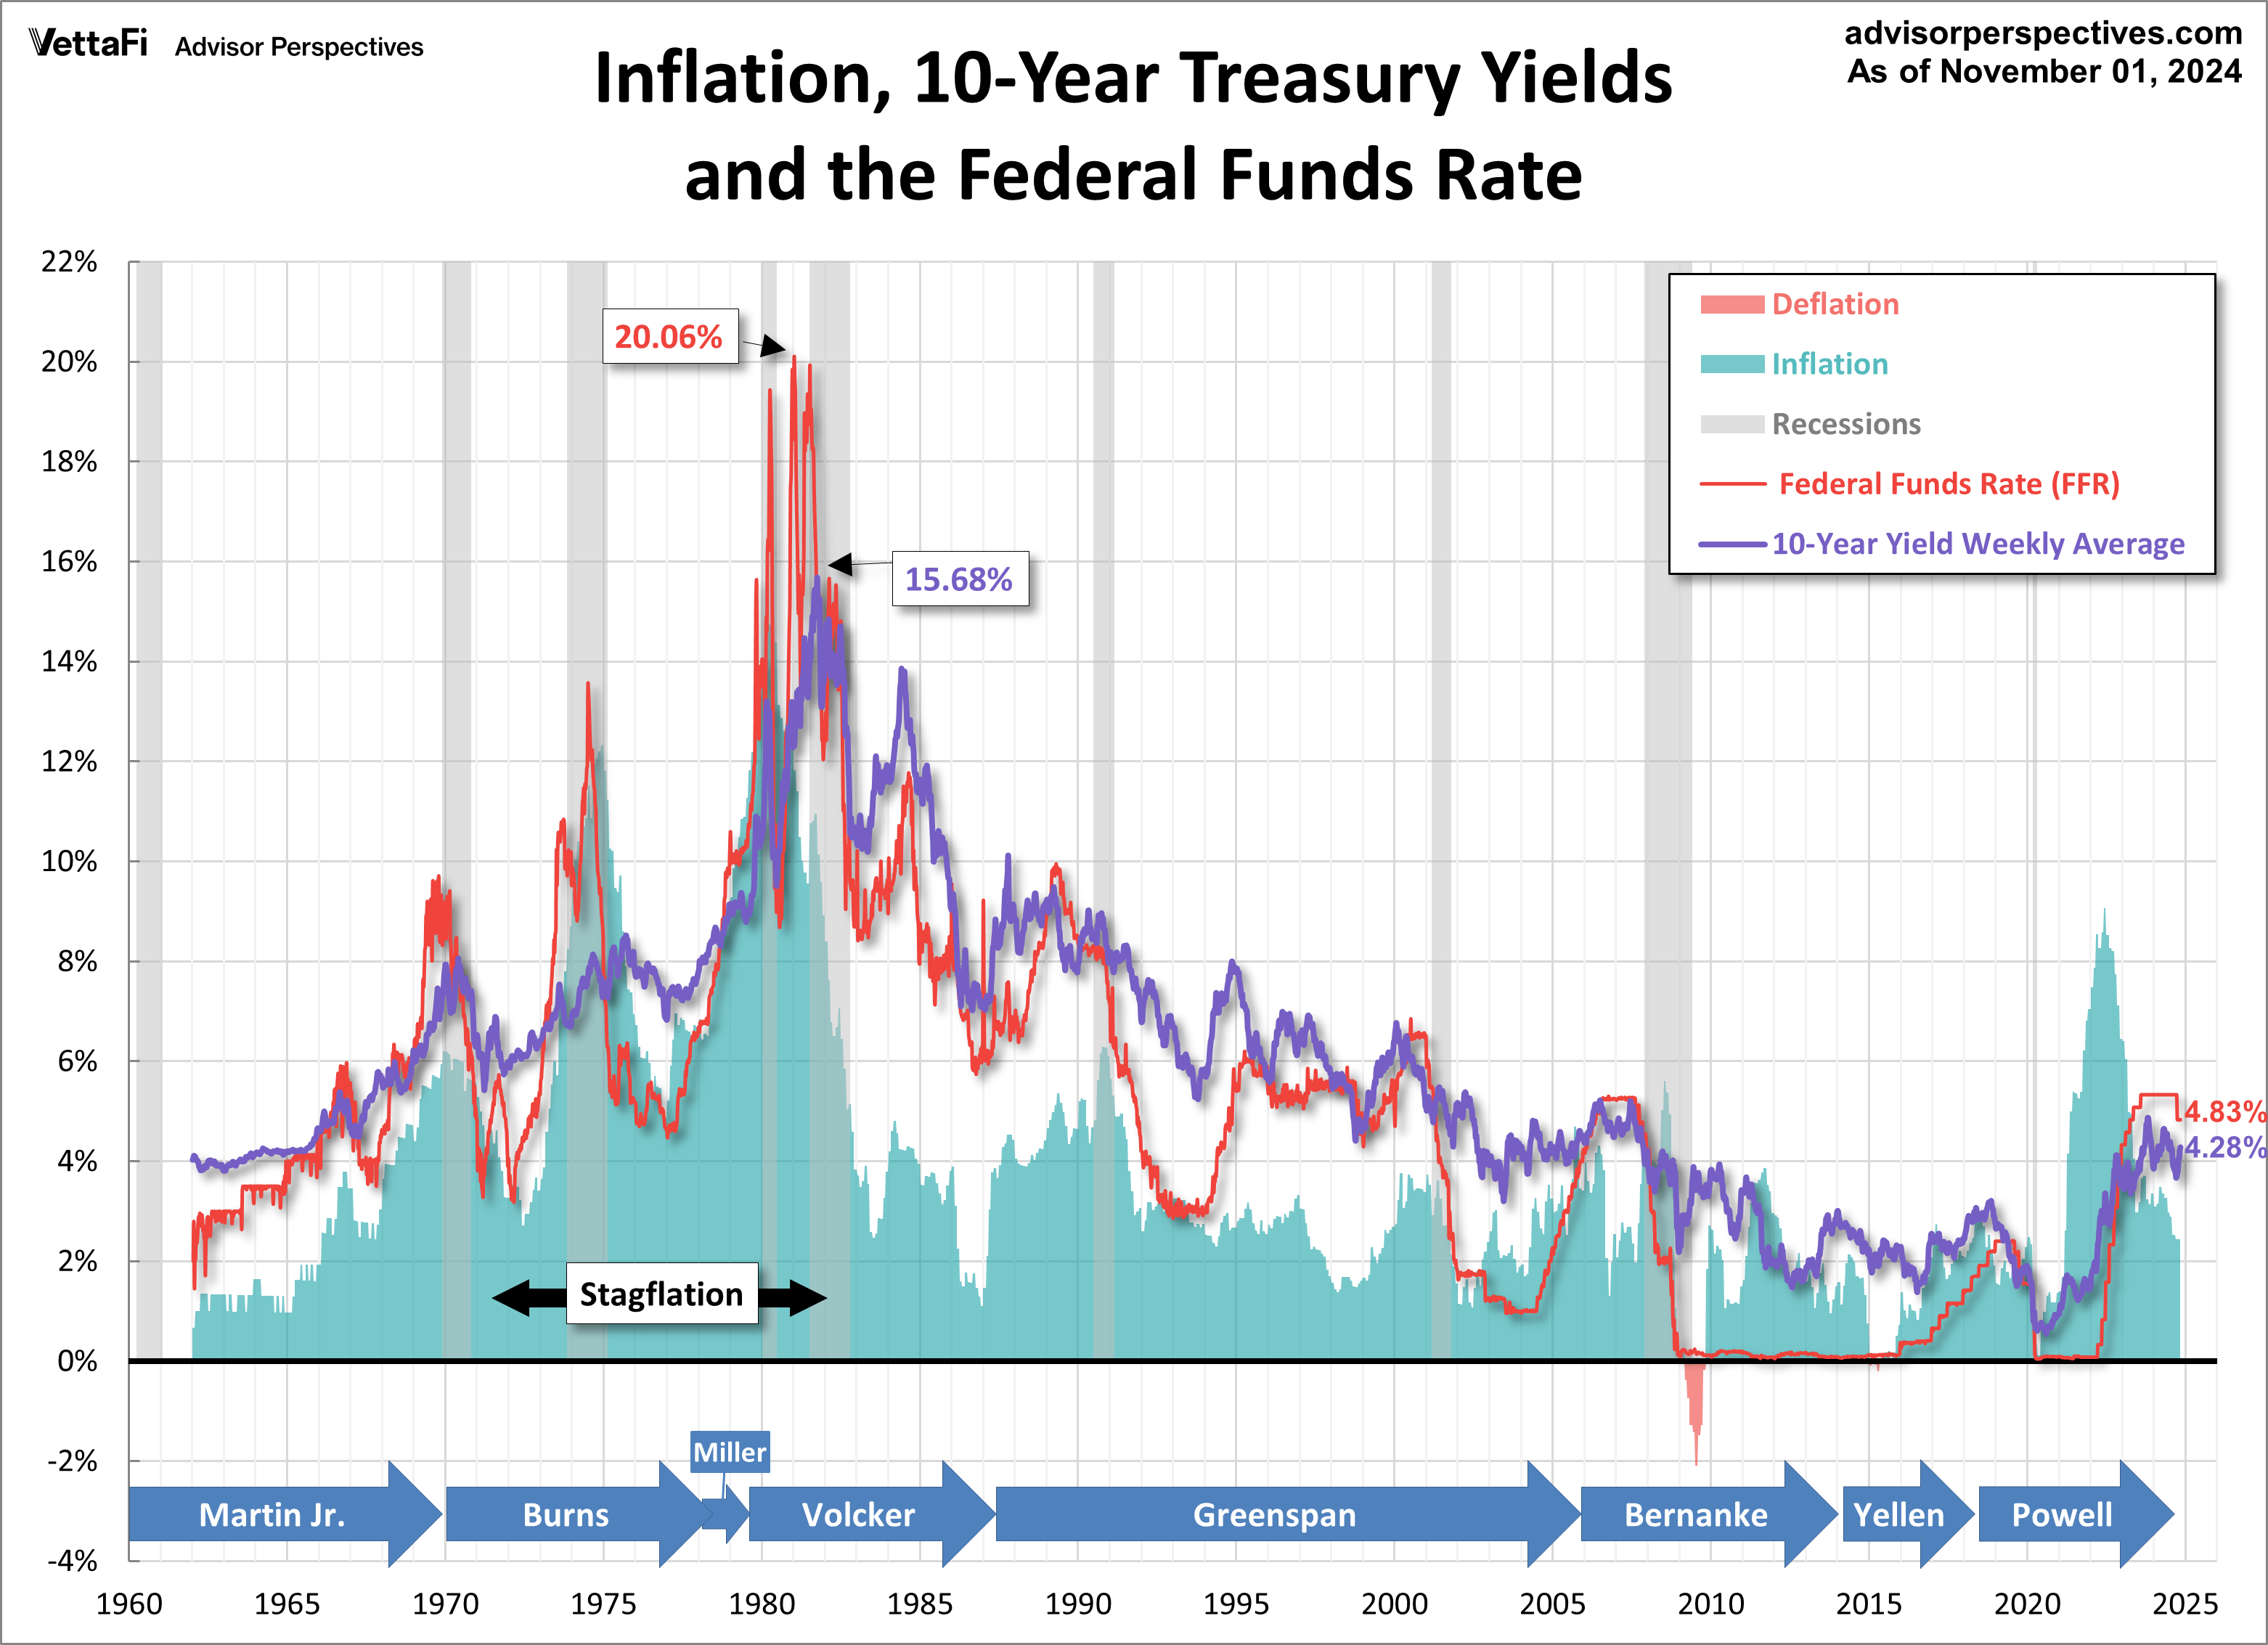
Chart source is given at the top right of the chart. This page is for amusement only, and should not be taken as advice to buy or sell anything.